
Development: Statistics
On this page you can find some regularly updated statistics about the OpenPKG project.CVS Repository Activity
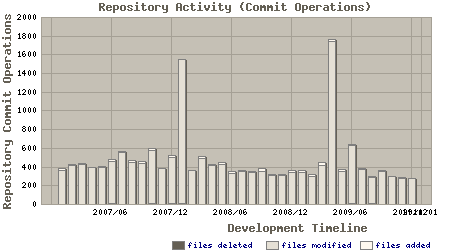
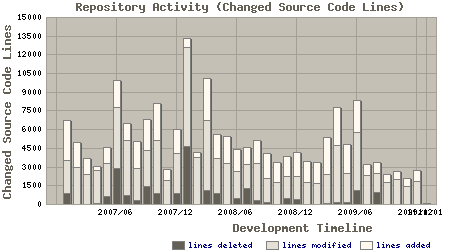
The following two charts summarize the development activity in the OpenPKG CVS repository. On the X-axis both charts show the time in month steps. On the Y-axis the first chart shows the number of CVS "commit" operations (individual repository transactions). On the Y-axis the second chart shows the number of file source code changes (lines added, modified or deleted).